Quick-Start Guide: Implementing Statistical Process Control (SPC)
Executive Summary: This quick-start guide walks manufacturers through the essential steps to successfully implement Statistical Process Control (SPC). It explains why SPC matters, outlines three core building blocks—data collection, control charts, and corrective action—and provides a 30-day plan to jumpstart continuous quality improvement. The guide emphasizes starting small, training teams, and using real process data to drive proactive decision-making with Zontec’s SynergySPC software.
November 11, 2025 | Whitepapers | Resources, Whitepapers
Table of Contents
Start Here
You’ve taken the first step toward a stronger quality control process by completing the SPC Readiness Audit. If your score shows room for improvement, you’re not alone — most manufacturers start small and build over time. This Quick-Start Guide will walk you through the essential actions to establish or strengthen your SPC program, gain process visibility, and prevent costly quality issues before they happen.
1) What SPC Is — and Why It Matters
Statistical Process Control (SPC) is a data-driven methodology for monitoring, controlling, and improving production processes. It helps manufacturers detect variation before defects occur, ensuring consistent quality, reduced waste, and improved customer satisfaction.
The emphasis here is on consistent high quality. It isn’t enough to produce quality sporadically; one bad product can hurt a company’s future sales. Inconsistent quality is also more expensive since bad parts have to be reworked or even scrapped. On the other hand, when quality improves, productivity improves, costs drop, and sales go up. ~The Book of Statistical Process Control
When properly applied, SPC transforms quality control from reactive inspection to proactive prevention. Instead of catching defects at the end of the line, you identify the cause as soon as data begins to drift.
2) The Three Building Blocks of SPC Success
1. Data Collection
- Identify key process variables (critical-to-quality features).
- Standardize measurement methods across operators and shifts.
- Begin with automated or semi-automated data collection to reduce entry errors.
2. Control Charts
- Choose chart types suited to your data:
- Variable data → X-bar & R or X-bar & S charts
- Attribute data → p, np, c, or u charts
- Set control limits based on real process data, not specifications.
- Train teams to interpret trends and signals — not just red/green indicators.
3. Corrective Action
- Create a simple rule set: who investigates, how to record causes, and how to verify fixes.
- Document every action for traceability and audit readiness.

4. Common Pitfalls to Avoid
- Too many charts, too little insight. Focus on the few processes that most affect your output.
- Using specification limits instead of control limits.
- Skipping operator training. The best charts mean little if people don’t understand what to do with them.
- Paper-based tracking. Manual systems lead to missing data and delayed response.
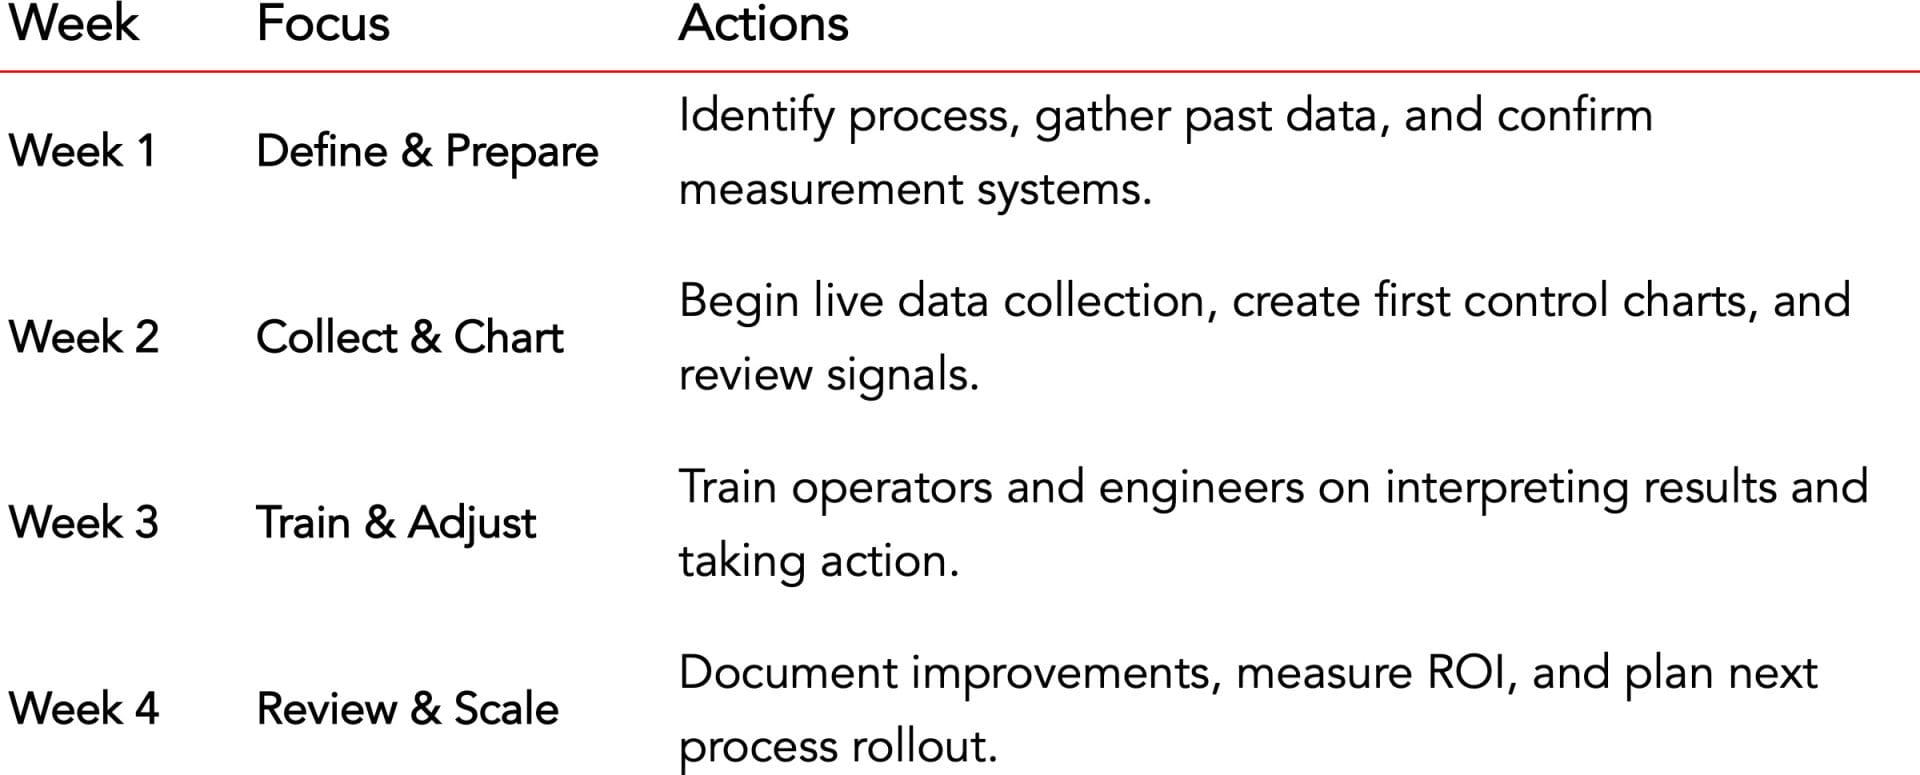
5. Your 30-Day SPC Jumpstart Plan
6. Tools & Templates to Accelerate Implementation
If you scored below 10 on your SPC Readiness Audit, start with:
- SPC Starter Kit: Excel templates or SynergySPC trial for control charts
- Operator Training Checklist: What every operator should know about limits, shifts, and trends
- Weekly Review Template: Track improvement actions and results
7. Next Step: Schedule a Complimentary SPC Consultation
If you’d like hands-on help setting up your first charts or selecting the right SPC tools, schedule a 20-minute no-obligation call with one of our SPC specialists. We’ll review your current data collection process and make recommendations on your best next steps.