How Synergy SPC Software Enables a Successful Six Sigma DMAIC Deployment
Executive Summary: Applying Six Sigma quality management tools allows manufacturers to improve their quality processes while also providing a significant cost savings. The Define-Measure-Analyze-Improve-Control, or DMAIC model, is a Six Sigma project deployment methodology that provides a step by step guide to improve performance of an existing product, process or service.
July 15, 2022 | Whitepapers | Resources, Whitepapers
Table of Contents
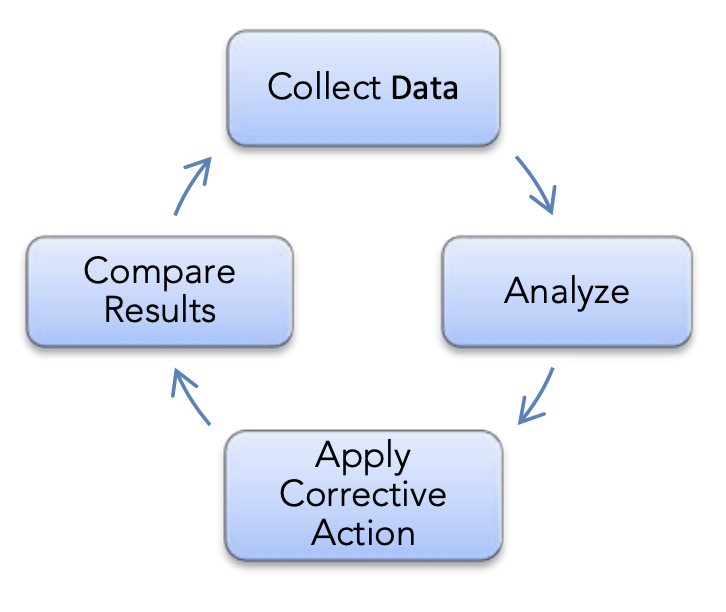
Six Sigma’s DMAIC Deployment Model
The model consists of 5 phases each with a defined set of criteria that must be satisfied before the next phase is begun. Statistical Process Control (SPC) software solutions assist in applying this Six Sigma methodology to real-world manufacturing environments.
Overview of DMAIC
D- Define the scope, potential resources, objective and schedule for the project. Define project team members and administer any required training.
M- Measure the existing system or process. Establish a process baseline and develop a reliable method/metric in order to monitor progress
A- Analyze the system to identify ways to eliminate the gap between current performance of the system or process and the desired goal. Use statistical tools to guide the data analysis and help you understand the data. Determine process drivers and sources of variation.
I- Improve the system by identifying ways of doing things better, cheaper or faster. Implement the new approach and use statistical methods to validate the improvement.
C- Control the new system by modifying compensation and incentive systems, policies, procedures, budgets, operating instructions and other management systems. Consider utilizing standardization such as ISO 9000 to ensure that documentation is correct. Use statistical tools to monitor stability.
SPC Software and the Define Phase
The Define Phase includes any project team training required for successful execution of the DMAIC process. This would include training for the SPC software solution being implemented. The training would allow team members to become familiar with the various functions and capabilities available in order to utilize the software in each phase of the 5-step process. The training should be targeted specifically towards the users and how to effectively implement in their manufacturing environment.
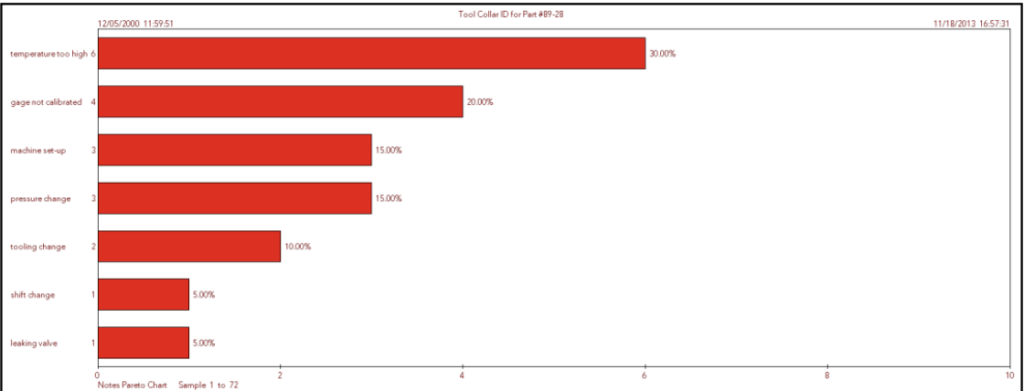
Various SPC charting options available can be utilized in the Define Phase. For example, Composite Pareto Charts allow team members to prioritize items to determine which problems/opportunities should be approached first. Pareto categories are sorted in decreasing order by count or cost (determined by setup), with overall percentage and number of occurrences.
Additionally, historical data can be imported into the software to generate rough estimates of quality, cost or schedule. These values will then be further validated and refined in the Measurement Phase. SPC tools are used first to determine if a process is in a state of statistical control, so that further analysis can be done to predict performance.
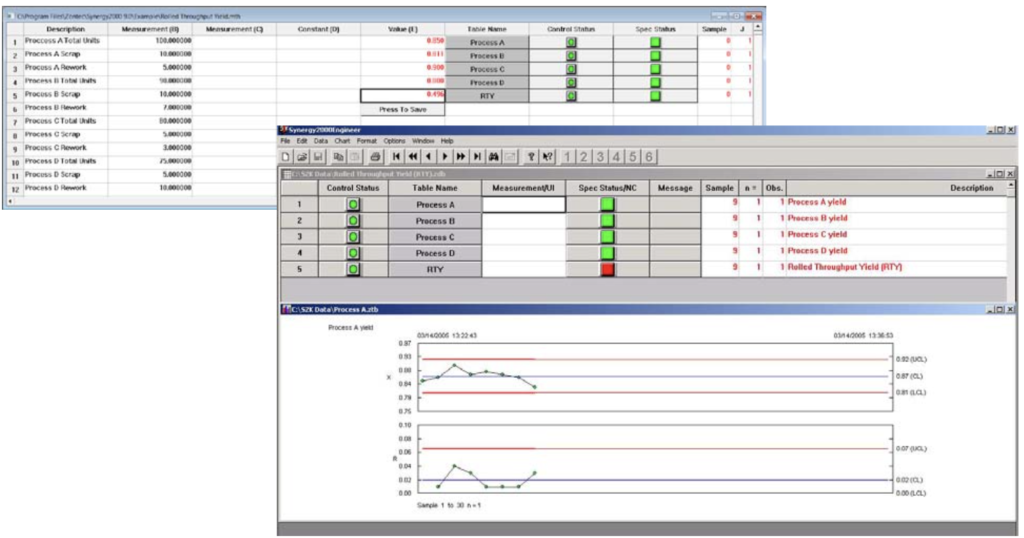
Critical to Quality (CTQ), Process Capability Indices, Roll Throughput Yield (RTY) and Sigma Level, and Overall Equipment Effectiveness (OEE)are process performance metrics identified to compare process observations against process requirements. The SPC software solution should provide various functions to allow easy comparisons of the metrics on different data sets.
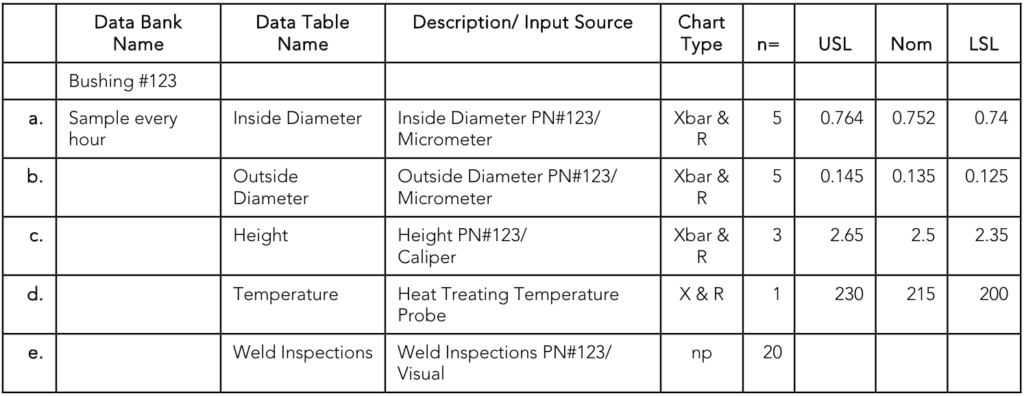
The creation of a data organizational chart, as shown below, allows you to compile the information on the various proposals for improvements. The chart should include a detailed inventory of data available, which characteristics will be monitored in the SPC software solution and which variables apply to the process being improved. This will provide the team with a better understanding of existing systems as well opportunity for data simulation to evaluate and make predictions in regards to performance.
SPC Software and the Measurement Phase
SPC software plays an integral part in the Measurement Phase. This phase includes developing a Data Collection Plan, validating the measurement system, entering data, and establishing a process baseline. The Data Collection Plan will define the layout and organization of the data which is based upon the goals and objectives of the data collection. The SPC software solution should provide options for both variable and attribute data collection on a part or process.
Data Collection Plan
Data Organization
Each part or process will have a defined set of characteristics being monitored. The part/process should be linked to the characteristics to allow users to easily access input, analyze, and report on all of thesample information that pertains to a specific operation. The project team needs to clearly define exactly which characteristics will be monitored and how. This will include type of data to be collected, which measurement devices will be used, how many samples are needed, how many observations per sample, at what time interval data will be collected, and if any historical will be imported.
Measurement System Validation
Prior to any data collection, the repeatability, reproducibility, accuracy and stability of the data must be verified. Gage R&R reporting, based upon current AIAG Standards, will provide the validation of the measurement system. A Gage R&R Study generated on trial data entered as well as Repeatability Range Chart, Part Operator Average Chart and Part By Operator Plot Chart will provide the documentation necessary for validation.
Data Entry/Process Baseline
To construct a process baseline, either historical data can be imported or data entry begun. The data is analyzed to establish a baseline of the process performance before any improvement efforts have been made. The baseline needs to be evaluated for validity and accuracy so future comparisons can be made
The process baseline will initially determine if the project should be pursued, allow the project team to become familiar with the process, and provide an estimate of cost savings. If the process is statistically stable, as evidenced by the SPC charts, then the baseline has provided the information for use in the Analyze Phase.
SPC Software and the Analyze Phase
The key objective in the analyze phase is it identify ways to eliminate sources of variation that contribute to the difference in current and desired process performance. Several charts are used in the analyze phase to help identify potential causes of variation.
Processes revolve around the combination of people, equipment, materials, methods and environment to produce a given product or service. Statistical process control is an important tool for monitoring, controlling, evaluating, and analyzing a process. The operating characteristics of the process determine product quality. To control and improve quality, it is first necessary to control and improve the process.
SPC is a mathematical way to look at a process, which takes into account the variations that are inherent to most aspects of a process. These variations are due to many chance causes, few of which can be predictedwith any certainty. Using SPC charts appropriate for the type of data available, the decisions-maker can confidently draw conclusions about the stability and capability of the process.
The target of an SPC software solution is to achieve stable, predictable process performance. To achieve this degree of control, SPC takes emotion out of the decision-making process. It measures the results against realistic, meaningful measures of past performance, not somebody’s idea of what performance should be. Statistics is used to separate those things about the process that are important from those that are less important. As the process evolves, the elements identified as critical will also change.
Some individuals erroneously think of SPC as the mere charting of process performance. This is only partially true. Charting is the visible part of the SPC process. Process control tends to be “tabular” in nature. Unfortunately, tables and spreadsheets often obscure critical information. Nor do these tables and spreadsheets invite comprehensive analysis. SPC, on the other hand, forces the user to collect enough data points to identify process trends and anomalies. SPC charts, being more visual than a spreadsheet, present information in a way that makes drawing conclusions more intuitively obvious. SPC only works effectively when action is taken on data contained in the charts. What action is taken in response to the charts is obviously much more important than how many chart are created.
The evaluation of assignable causes associated to an out-of-specification condition, control trend test violation or out-of-
control condition
will assist in pin-
pointing sources of variation. Pareto Charts can be generated to identify a percentage break down and number of occurrences for each assignable cause.
The ability to query out data based upon any combination of key identifiers, assignable cause, and/or Date/Time range provides the ability to make side by side comparisons of data based upon batch #s, operators, date/time, or other information tagged to the data. Charts can then be generated on the queried data.
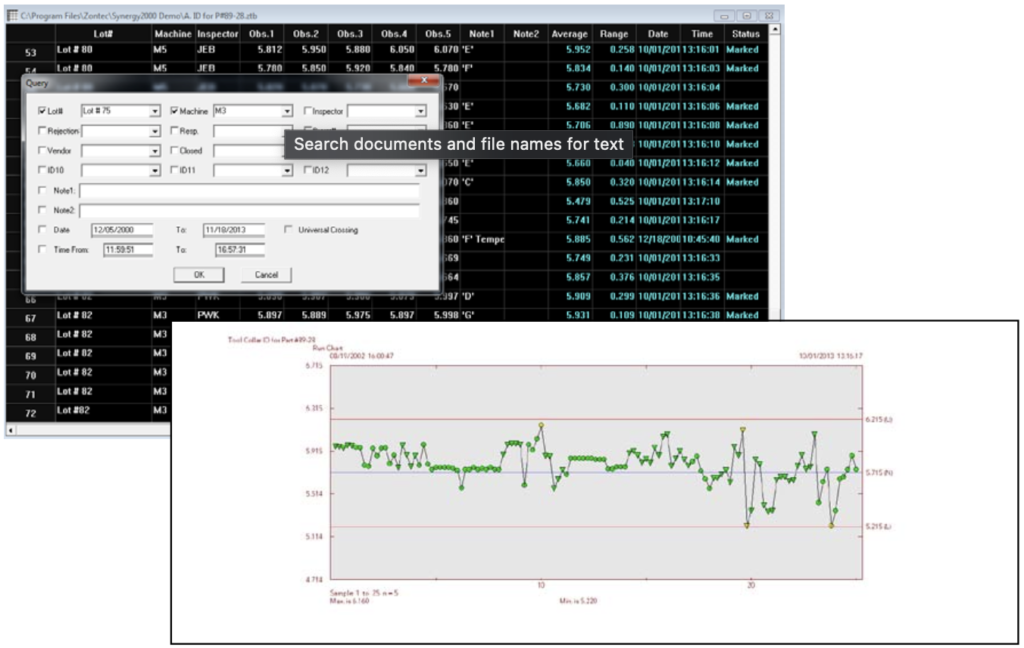
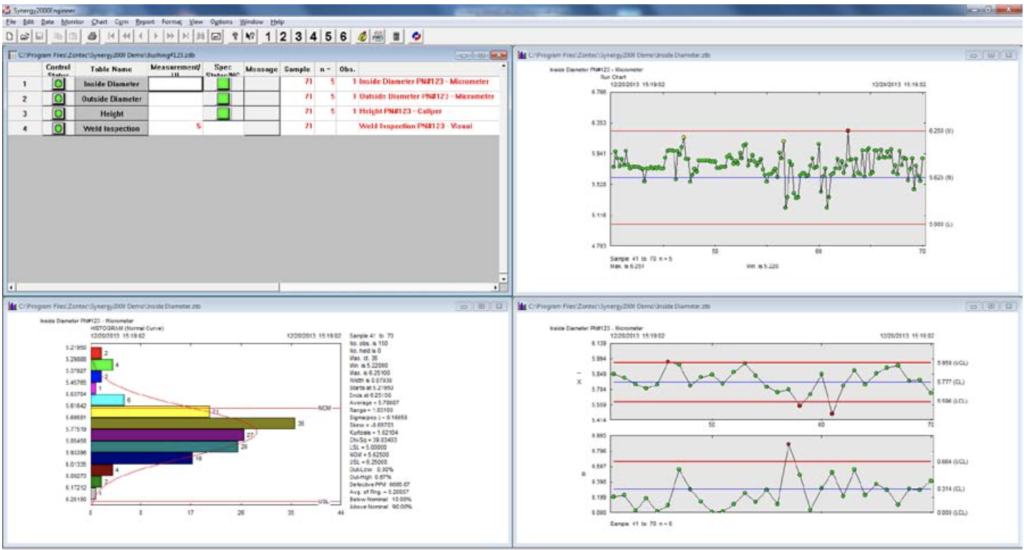
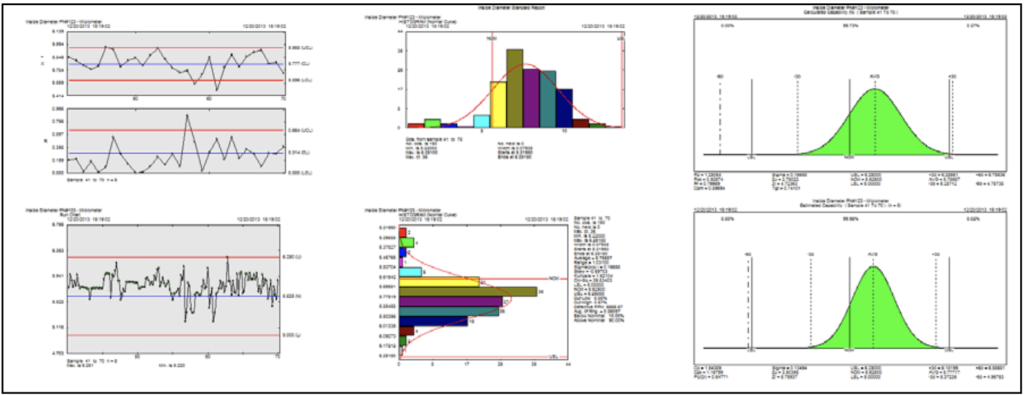
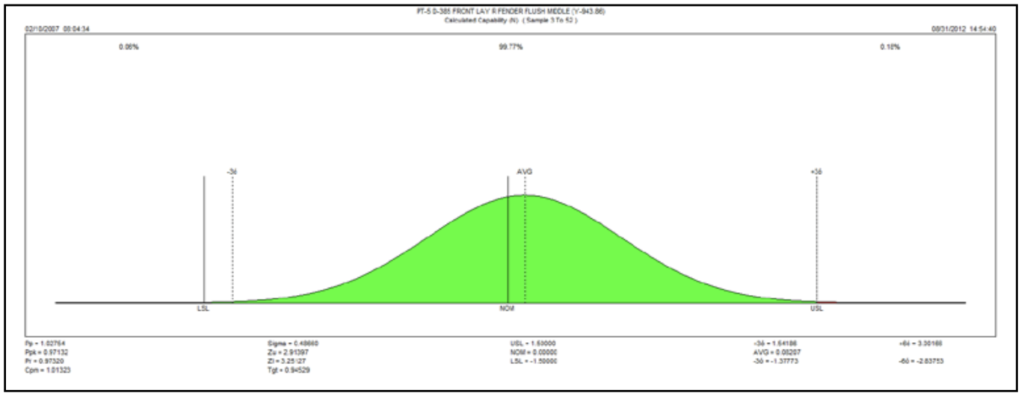
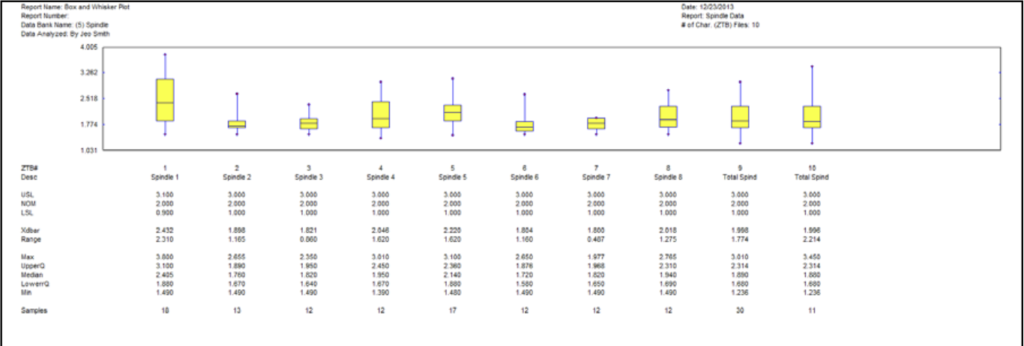
Several SPC charting options allow you to correlate one data set with another. The Overlay Control chart, Overlay Run chart and High/Low Run chart provide further comparison data sets. Box and Whisker Plots are also a useful tool to view the spread of data and how much variation exists. The Box and Whisker Plot focuses on the median, extremes, and quartiles and comparisons among them. Histograms allow you to view the distribution of values in a data set in comparison to the normal bell curve. This can help pinpoint particular patterns or outliers. Control Charts will provide notification of any trends or out-of-control data and prompt an investigation into the cause.
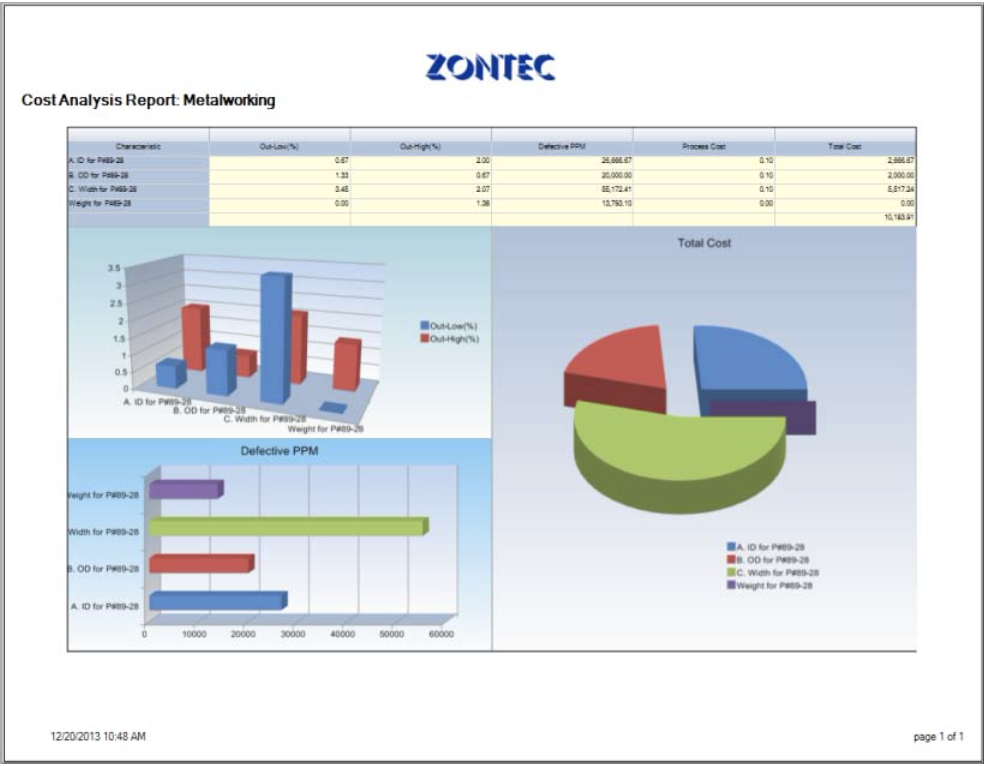
Reports are also a useful tool in providing calculated statistical values for analyzing data. Reporting options should include the option to query the data contained in the report. Comparing number of out-of- specification data points, total readings, number of out-of-control conditions and process indices are valuable SPC values for analysis. Other reports comparing additional values such as min, max, average, Z-scores, standard deviation, chi-squared, etc. for characteristic being monitored are also beneficial.
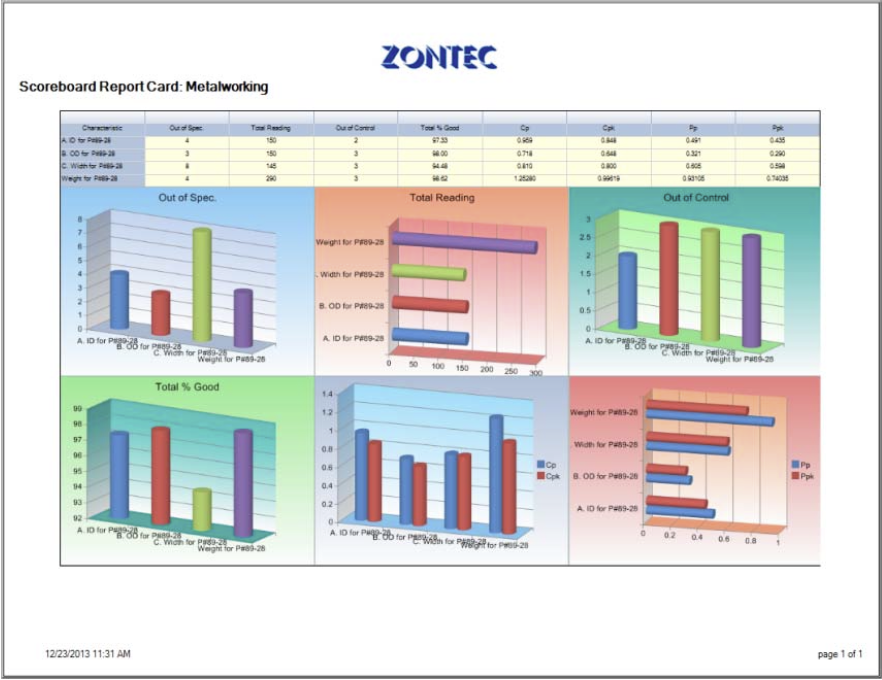
Reports are also a useful tool in providing calculated statistical values for analyzing data. Reporting options should include the option to query the data contained in the report. Comparing number of out-of- specification data points, total readings, number of out-of-control conditions and process indices are valuable SPC values for analysis. Other reports comparing additional values such as min, max, average, Z-scores, standard deviation, chi-squared, etc. for characteristic being monitored are also beneficial.
SPC Software and the Improve Phase
Potential solutions are evaluated then selected in the Improve Phase. Pilot testing is conducted before full implementation. During pilot testing, flexible charting options in SPC software solutions become very useful. Side by side comparisons should be made of charts generated on data prior to process change with data post process change. Therefore, determining if a process change was actually an improvement is very simple.
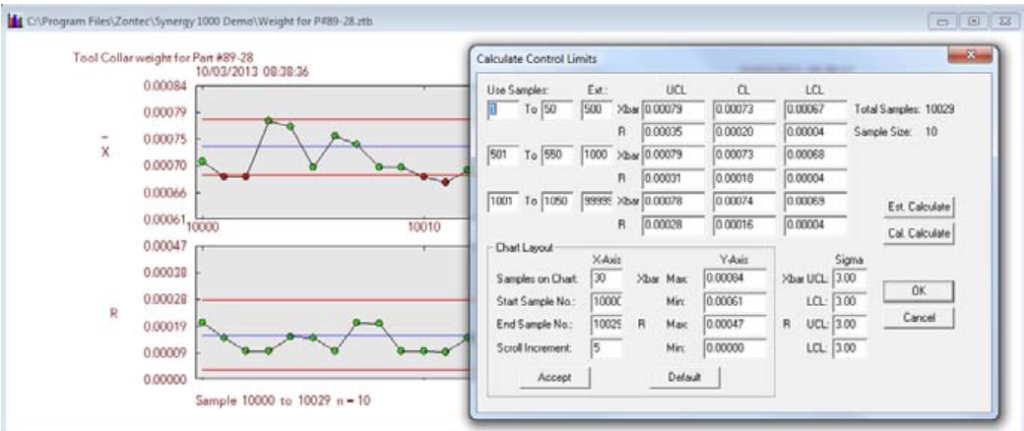
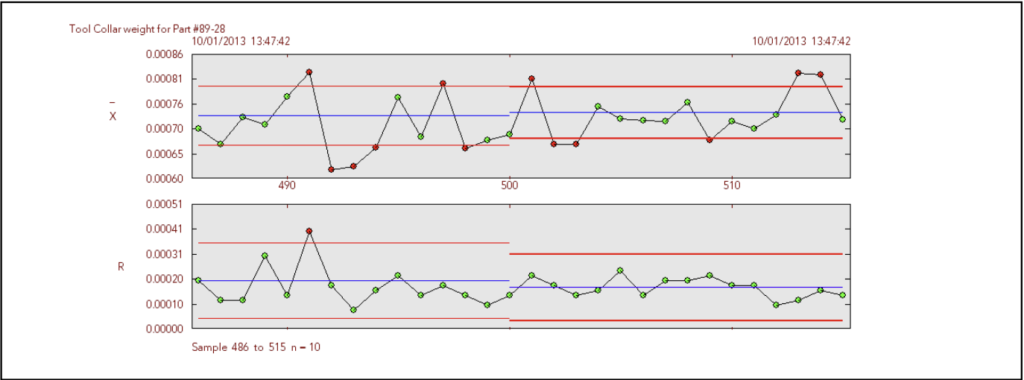
Recalculating control limits is another useful tool in determining if a process change was an improvement. The ability to display up to 3 sets of control limits on a single variable chart allows easy detection of control limits being tightened after a process change. By offering the ability to define a specific range of samples to calculate control limits the engineer can specify the example samples following a process change.
By the end of the Improve Phase, team members need to validate the proposed process changes. Solutions that counter root causes and improve can be identified by comparing the metrics to the process baseline.
SPC Software and the Control Phase
The Control Phase involves statistically validating that the new process meets the objectives and benefits outlined in the Define Phase. The pilot testing provides the information necessary in establishing and implementing a new control plan for full implementation. This includes documentation of lessons learned, design changes, modified control plan, and/or procedures.
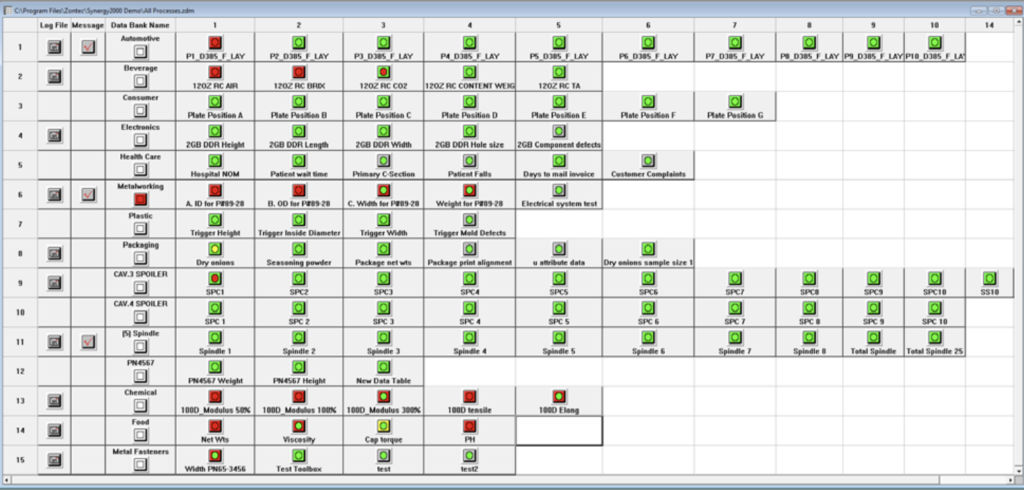
The project does not end here. Continuous data collection is required to monitor stability and ensure that the gains are permanent. Enterprise-wide monitoring of multiple processes providing indication of the current process status at a glance is ideal. Real-time status indicators will flag any process issues and provide notification of which specific characteristic need to be investigated.
SPC Software and DMAIC
Implementing this Six Sigma project deployment methodology effectively manages process improvement projects and ensures an increase in quality and reduction in defects. Statistical Process Control (SPC) programs provide powerful tools to apply in each phase of the Define, Measure, Analyze, Improve, Control (DMAIC) model. From prioritizing opportunities in the Define Phase, to providing users access to process control plans in the Control Phase, SPC software solutions can provide assistance in moving forward through each phase of the project.